Software engineering · Feb 2025–present
HealthCam
A modular platform that turns webcam video into measurements alongside desktop app usage. Heart-rate estimation and blink detection run as replaceable local analyzers; a cloud dashboard makes their results available over time.
My contribution · end-to-end design and development
- Backend & systems
- Python services, async orchestration, and authenticated APIs.
- Data engineering
- PostgreSQL, incremental SQL aggregation, and weighted metrics.
- Web product
- User-scoped Next.js dashboards and a read-only demo.
Choose “Explore the demo” on the sign-in page. No account or webcam required. Read-only synthetic data.
- My role
- End-to-end design and development
- Stack
- Python · FastAPI · TypeScript · Next.js · PostgreSQL · Docker
- Origin
- BSc thesis · University of Milan
- Status
- 3.0 · Plugins · Developer preview
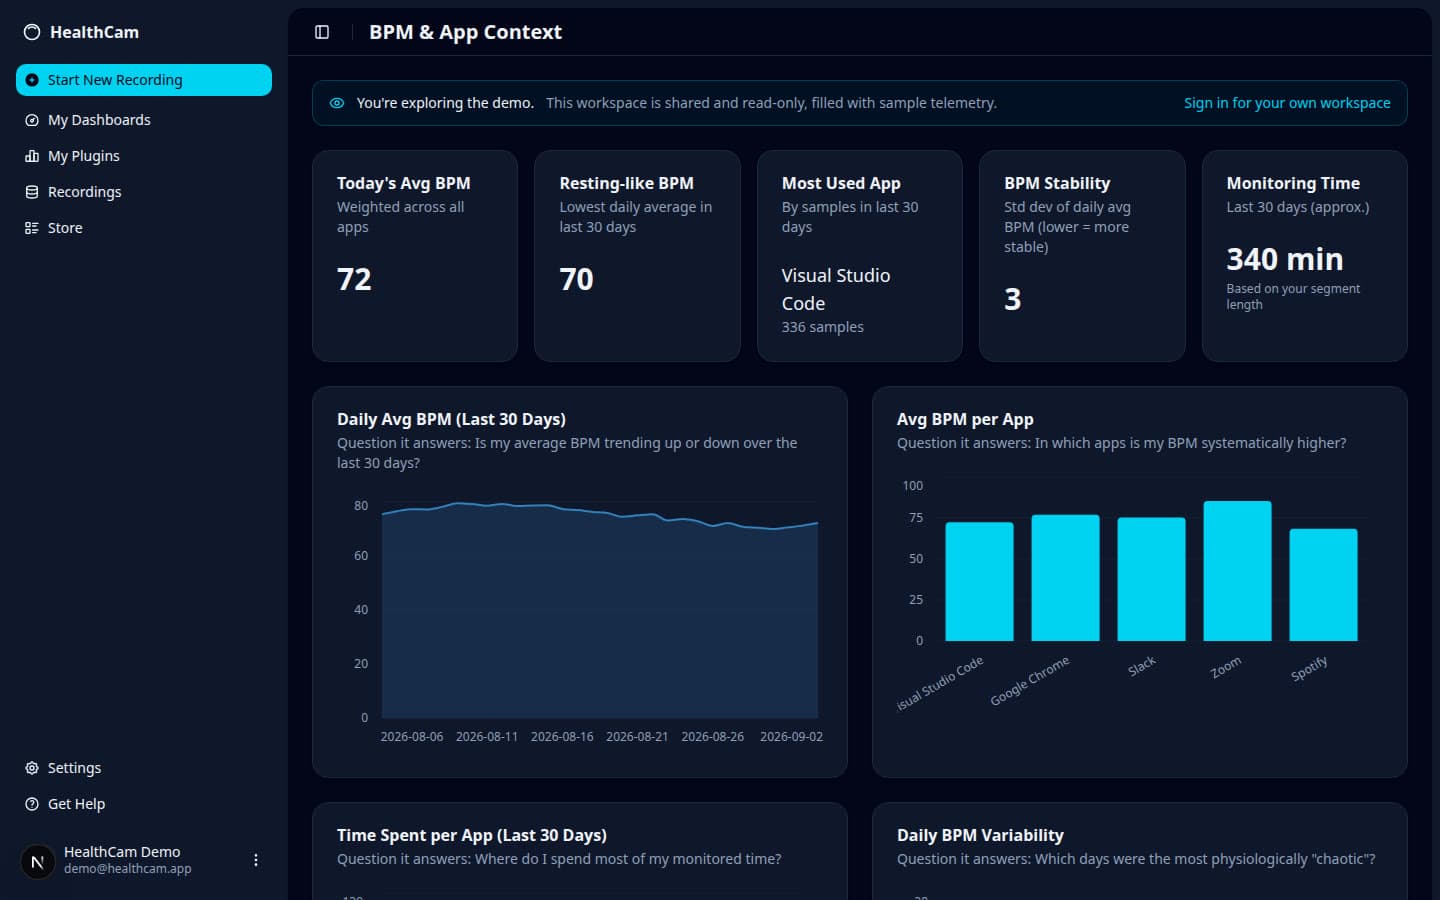
Trends over time
Daily averages of estimated heart rate.
App comparisons
Measurements paired with active-application context.
Data coverage
Monitoring duration helps interpret the results.
Synthetic demo data. Demonstrates the product and its queries; does not establish measurement accuracy.
01 · Architecture
Capture once. Run multiple analyzers.
HealthCam 3.0 routes each webcam segment to enabled analyzers in parallel and aligns their results with active-app context. A service registry discovers capabilities; manifests configure native processes and Docker containers. Structured results go to an authenticated cloud API.
On the computer · Python / FastAPI
Webcam → 20-second segments
Local video and timestamp metadata
Orchestrator + service registry
Manifests: runtime, lifecycle, and capabilities
Same segment → parallel analysis
Heart rate · pyVHR
Replaceable plugin
Blink · MediaPipe
Custom blink processing
Results + app context → queue
App-Tracker → events aligned to segment timestamps
Results and context
Authenticated JSON · no video
In the cloud · Next.js / PostgreSQL
Ingestion API
API key → user · Zod validation
Raw telemetry · JSONB
Results, context, and metadata
GitHub Actions → SQL summaries
Incremental every 5 min · daily reconciliation
User-scoped dashboards
Trends, comparisons, and coverage
02 · Engineering decisions
Designing for replaceable components
I built the capture, orchestration, service lifecycle, ingestion, database pipeline, and web application. The heart-rate analyzer integrates pyVHR; the blink analyzer uses MediaPipe landmarks with my own processing logic.
Local inference, cloud history
Video stays on the device; the cloud holds results that can be explored over time.
Trade-off: Manual setup and hardware constraints: the current BPM analyzer requires NVIDIA/CUDA.
Native processes and containers
Capture and context use OS APIs; containers isolate analysis dependencies.
Trade-off: More environments to start, connect, and diagnose.
Manifests and a shared contract
A new analyzer declares its runtime, commands, and capabilities; the registry makes it discoverable by the orchestrator.
Trade-off: New metric-specific SQL and dashboard interfaces still need application code.
Research components integrated: pyVHR / PHuSe Lab for heart rate; MediaPipe for face landmarks. I did not develop their underlying algorithms or models.
03 · Data engineering
Prepare summaries before the dashboard needs them
Raw JSONB telemetry is retained in PostgreSQL. GitHub Actions runs incremental SQL aggregation on a five-minute schedule and a daily reconciliation job. Dashboards query summary tables instead of repeatedly scanning the full telemetry history.
Every 5 minutes
Incremental aggregation
A cursor selects new payloads. SQL upserts update sums, counts, extrema, and duration by user, day, and app.
Daily · 02:10 UTC
Reconciliation
Rebuilds recent summaries from raw records, starting two days before the latest summary date, to include delayed data within that window.
On dashboard reads
Query summary tables
Averages are weighted by sample count: days with little data do not count as much as days with many samples.
Precomputation keeps historical scans off the dashboard request path. The trade-off is delayed freshness and maintaining both raw records and derived summaries.
Transformation assumptions and limits
Each segment is attributed to its last app-context event and bucketed by send time (or receipt time), rather than split across app switches. Capture timestamps remain in the raw payload. Reconciliation covers a recent window; it does not automatically repair arbitrarily old late arrivals. Scheduled jobs can be delayed; no performance improvement has been benchmarked.
Engineering evidence · 30 September 2026
15 passing tests · data contract and API
6 API checks and 9 data-contract checks, with mocked database access. Cover authentication, validation, write requests, and rate limiting; not the full pipeline.
Results, example test, and reproducible report
- Authentication
- Missing or unknown key → 401.
- Validation
- Malformed JSON or a contract-invalid payload → 400.
- Ingestion
- Valid payload → 201 and a write call tied to the authenticated user.
- Request limit
- Cap reached → 429, Retry-After: 60, and no write call.
Inspect a test: rejecting requests over the cap
Excerpt from the existing test. The database mock returns a count at the cap; assertions check the response and absence of writes. The key shown is a dummy value.
db.user.findUnique.mockResolvedValue({ id: "user-1" });
db.recordingPayload.count.mockResolvedValue(INGEST_RATE_LIMIT.max);

const response = await POST(
  request(validCloudRequest(), { "x-api-key": "valid-key" }),
);

expect(response.status).toBe(429);
expect(response.headers.get("Retry-After")).toBe("60");
expect(db.recordingPayload.create).not.toHaveBeenCalled();
Scope: isolated contract and API tests. They do not verify real PostgreSQL persistence, concurrent requests, agent retries, or measurement accuracy. The contract accepts an analyzer error result; dispatching that result from the agent is not verified by these suites.
Download the report: results, revision, and reproduction (Markdown)04 · Research & evaluation
Evaluating one analyzer within the platform
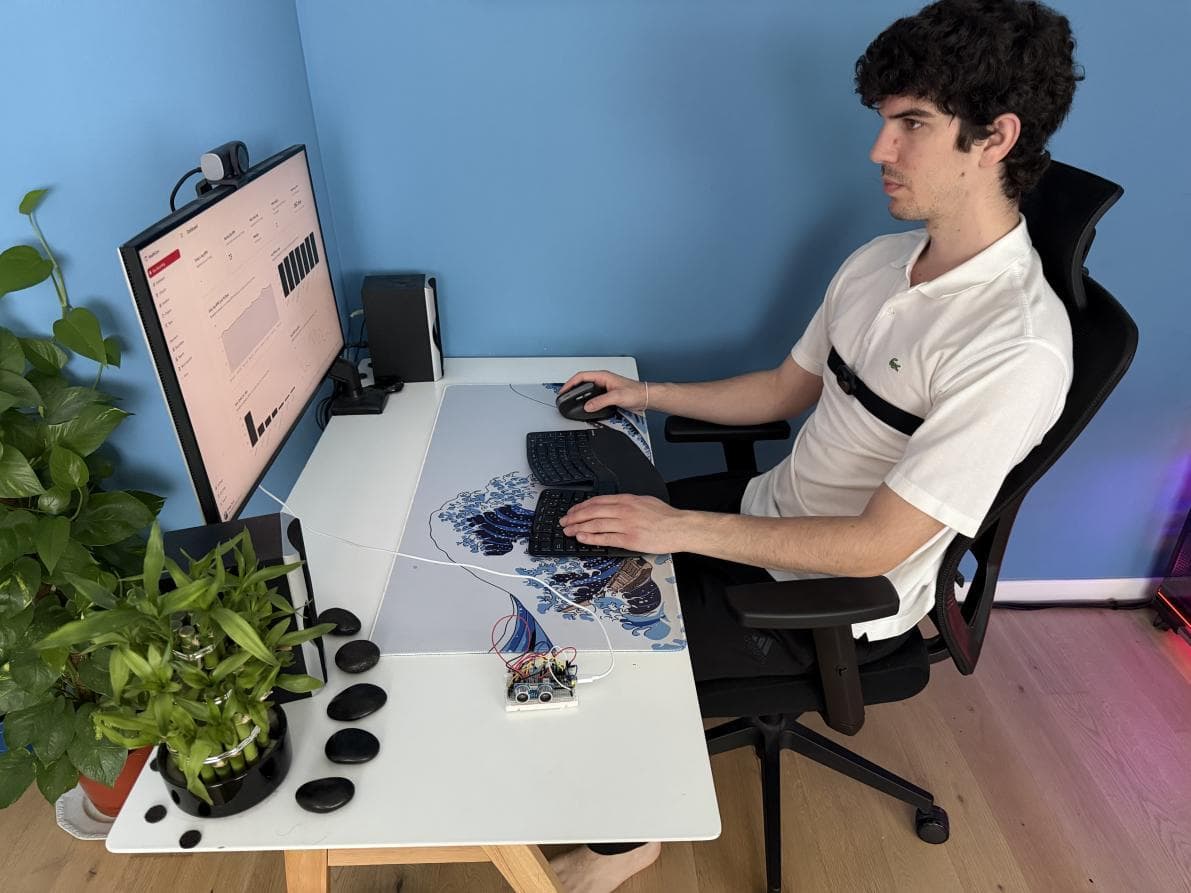
For my thesis, I integrated pyVHR, a PHuSe Lab research package from the University of Milan, as the webcam heart-rate analyzer (rPPG). HealthCam’s capture, orchestration, storage, and dashboard layers are separate from that estimator’s accuracy.
Mean absolute error≈ 11.6 BPM
App-level differences≈ 3 BPM
I aligned estimates with a Polar H10 reference and examined error, agreement, and lighting. The tested setup could not reliably resolve these differences; the finding applies to that estimator configuration and experiment.
Source: HealthCam 2.0 thesis presentation, slides 10–11.
Replaceable analyzers were an architectural goal of the project. The experiment limits how this estimator can be used; another analyzer can reuse capture, orchestration, and ingestion.
Method, sources, and reproducibility limits05 · Data handling
Video stays on the device
The agent uploads results, application/window context, timestamps, and file metadata. Video and sidecar files are deleted after successful analysis and upload; failures can retain them locally. Derived data is still sensitive. Local APIs currently require a trusted development machine because they lack authentication.
What you can evaluate today
The system, the result, and the next steps.
2.0 · Thesis: separated services and initial rPPG evaluation. 3.0 · Today: manifests, a capability registry, and multiple parallel analyzers.
Implemented
- Webcam capture and active-app context
- Parallel rPPG and blink analyzers
- Manifest-configured local services
- Authenticated ingestion, PostgreSQL, and BPM dashboard
Still in development
- Packaged installer for end users
- Service installation through the Store
- Complete blink dashboard and alerts
- Durable dispatch, idempotent ingestion, and broader integration tests
Current reliability limits
The dispatch queue is in memory. One failed analyzer prevents the entire segment from being sent, even when other analyzers succeed; failed uploads are retried. Durable queuing, partial-result handling, and idempotent ingestion are next steps. The published tests do not verify the complete webcam/GPU/database path.
The demo demonstrates the interface. Local execution requires private repository access, manual configuration, and compatible hardware. An experimental thesis and portfolio project, not a medical device.
Contact
Let’s talk about a role, a collaboration, or an idea worth building.
If you are considering my profile, would like to collaborate, or have an operational problem to solve, write to me. We can start from the context even if every answer is not clear yet.
Or email me directly diego.webwork@gmail.com
Verona and Northern Italy. Available for employment and freelance projects. Open to relocation.